

Founder & Editor · Last reviewed 2026-07-14
Looking for the current Grand National?
Our live guide has 2026+ racetimes, TV coverage and runners as they're confirmed.
See the Grand National live hubThe Grand National attracts more casual betting money than any other race in the British calendar. Around £250 million is wagered nationally each year by punters, many of whom will not place another bet for twelve months.
We spent the days before the 2026 race building a machine learning model to find genuine value bets across all 34 runners.
We found none. Not one.
This article explains what we built, what we found, and the mathematics that shows why the bookmakers have a structural advantage in the Grand National that no prediction model can fully overcome.
Where to Bet
Place your bets with a trusted, licensed bookmaker.
Promo code BETFRED50. New UK & Gibraltar customers only, 18+. Register and deposit a minimum of £10 using debit card, Apple Pay or Truelayer Instant Bank Transfer (e-wallets and prepaid cards excluded). Place a first bet of £10 or more at minimum odds of Evens (2.0) on any sportsbook market within 7 days of registration. Once settled you receive 3 × £10 sports free bets plus £20 in Bet Builder free bets (World Cup structure, 8 June – 15 July 2026; reverts to 2 × £10 acca free bets, 4+ selections win only, from 16 July). Free bets are credited within 10 hours of qualifying-bet settlement and expire 7 days after credit. Free-bet stake is not returned with winnings. One offer per person, household, IP address and device. Take Time to Think. BeGambleAware.org. 18+. T&Cs apply. Full T&Cs.
Promo code BET20GET10. New UK 18+ customers only. Minimum deposit £10 via debit card. Minimum qualifying bet of £20 at minimum odds of Evens (2.0) — single bet, settled in the same registration session. Bonus credited as 2 × £5 free bets: first paid automatically on settlement of the qualifying bet, second £5 credited 24 hours later. Free bets restricted to accumulators of trebles or greater at minimum odds of 4/1 per leg. Free-bet stake is not returned with winnings. Free bets expire 24 hours after credit. PayPal, Skrill, Neteller and Paysafe not supported sitewide. Take Time to Think. BeGambleAware.org. 18+. T&Cs apply. Full T&Cs.
50% of your first-day net losses refunded as a free bet, capped at £25. New UK customers aged 18+ only — one offer per person, household, IP address and device. Customers registered with GAMSTOP cannot claim. Minimum deposit £10 via Visa Debit, Mastercard Debit, Apple Pay or bank transfer; PayPal, Skrill, Neteller and prepaid cards are not supported. KYC identity verification must be completed before the free bet is credited. Free bet is stake-not-returned. Verify the qualifying-stake threshold, minimum-odds requirement and free-bet expiry on QuinnBet's live welcome-offer page before claiming. Take Time to Think. BeGambleAware.org. 18+. T&Cs apply. Full T&Cs.
New customers, 18+. Choose the sports bonus at sign-up, make a first deposit and receive a 100% bonus up to £50 in your Sports Bonus balance. To convert the bonus to cash, wager it 10x within 30 days. Single bets below Evens (2.00) do not qualify; accumulators do not qualify if any selection is below 1/2 (1.50). Virtual Sports, voided, cancelled, drawn, cashed-out and free-bet wagers do not count towards wagering. Only the first settled bet per event counts. Withdrawing before the wagering requirement is met forfeits the bonus balance including bonus winnings. Real-money funds are used before bonus funds. Deposits via Skrill or Neteller are not eligible. Not valid in conjunction with other promotions. Odds, bet and payment limits apply. 10bet general and promotion T&Cs apply. BeGambleAware.org. 18+. Full T&Cs.
New UK & Ireland customers, 18+. Opt in at registration (no promo code). Deposit £10+ by debit card and place a £10 fixed-odds qualifying bet at minimum odds of 1/2 (1.50) — single or each-way, not in-play and not cashed out. Receive £60 in bonuses: 3 × £10 fixed-odds free bets plus 6 × £5 sports spread bets, credited over consecutive days; free bets valid 28 days from issue. IMPORTANT: the 6 × £5 are SPREAD bets — sports spread betting carries the risk that losses can exceed your stake (Spreadex states 61% of its retail spread/CFD customers lose money). Sports spread-betting customers do not have Financial Ombudsman or FSCS recourse. A lone secondary advertises an 'up to £100' variant — always confirm the live terms on Spreadex's own sign-up page before opting in. Take Time to Think. BeGambleAware.org. 18+. T&Cs apply. Full T&Cs.
Promo code WELCOME15. New UK customers, 18+. Register and place a first qualifying bet of at least £10 from your cash balance at odds of evens (2.0) or greater within 7 days of opening the account. Once the qualifying bet settles you receive £15 in free bets, credited as 3 x £5 tokens. Free-bet stake is not returned with winnings. Free bets expire 7 days after they are credited. One offer per person, household, IP address and device. Confirm the current terms on BetGoodwin's own welcome-offer page before claiming. Take Time to Think. BeGambleAware.org. 18+. T&Cs apply. Full T&Cs.
New UK customers, 18+. Minimum deposit £10. Place a £10 qualifying single at minimum odds of 1/2 (1.50), settled within 14 days. Receive £30 in free bets (stake not returned). Free bets must be accepted within 7 days and expire 7 days after acceptance. No promo code required. Best Odds Guaranteed on UK & Irish racing. Operated by LiveScore Betting and Gaming (Gibraltar) Ltd, UKGC 56859. Confirm the current terms on LiveScore Bet's own promotions page before claiming. Take Time to Think. BeGambleAware.org. 18+. T&Cs apply. Full T&Cs.
18+. BeGambleAware.org
What Is a Value Bet in Horse Racing?
A value bet exists when your estimated probability of a horse winning is higher than the probability implied by the bookmaker's odds. If you believe a horse has a 25% chance but the odds imply only 20%, the price is too generous relative to your assessment. You have found value.
Value is independent of whether the horse actually wins. You can place a value bet and lose. You can place a poor-value bet and win. Over a large enough sample, value bets produce profit. Poor-value bets produce losses. The Grand National is one race, not a large sample, but the value question is still the right one to ask.
The challenge is that bookmakers do not price races at random. They employ teams of traders, observe how professional money moves on the Betfair Exchange, and adjust prices in real time as odds shift throughout the week. By race time, the market has absorbed a great deal of information. Finding a horse that is systematically mispriced against all of that is difficult.
How We Built the Prediction Model
The system works in two stages. We have written about the full process in our AI prediction models guide, but the summary is straightforward.
Stage one: structured data model
We downloaded three years of UK National Hunt race data: results, form figures, going conditions, weights, jockey and trainer statistics, and official BHA ratings. We also pulled historical weather data from Open-Meteo for each racecourse on each race day as a secondary signal for ground conditions.
On top of that data, we trained an XGBoost classifier. XGBoost is a gradient-boosted decision tree model widely used in competitive machine learning for structured prediction tasks. For each runner in a race, the model outputs a win probability. Those probabilities are normalised within each race so they sum to 100%.
Stage two: retrieval layer
Form data does not capture everything. A horse returning from injury, a trainer known to target specific festivals, a jockey with a poor record in big fields. This qualitative information exists in race commentary and tipster analysis, not in the structured numbers.
We built a retrieval layer to access it. Publicly available race previews were embedded into a searchable index. At prediction time, the system retrieves the most relevant commentary for each horse and passes it to a language model, which returns a small probability adjustment with a one-line justification. The adjustment is capped at 10 percentage points either way to prevent the language model from overriding the statistical foundation.
The combination produces a probability per horse, per race. We then compared those probabilities against the bookmaker prices available before the 2026 Grand National.
Zero value bets across 34 runners
After running all 34 Grand National runners through the model at available pre-race prices, we found no horse where our estimated win probability was high enough to constitute a genuine value bet once the bookmaker's margin was factored in.
The table below shows the model's estimated expected loss per £1 staked on some of the main contenders, at starting prices:
| Horse | SP | Expected loss per £1 |
|---|---|---|
| I Am Maximus | 9/2 | ~12p |
| Panic Attack | 7/1 | ~15p |
| Jagwar | 17/2 | ~17p |
| Grangeclare West | 9/1 | ~18p |
| Johnnywho | 12/1 | ~21p |
| Iroko | 18/1 | ~26p |
| Marble Sands | 66/1 | ~42p |
| Answer To Kayf | 100/1 | ~48p |
Model estimates at starting prices. Based on 143% overround with favourite-longshot bias adjustment.
Two things stand out. First, every horse carries a negative expected return. Second, the gradient: the longer the price, the heavier the expected loss per pound staked. The favourite is the least-bad bet on the card; the 100/1 shots are the worst. The reason for both sits in how bookmaker markets are structured.
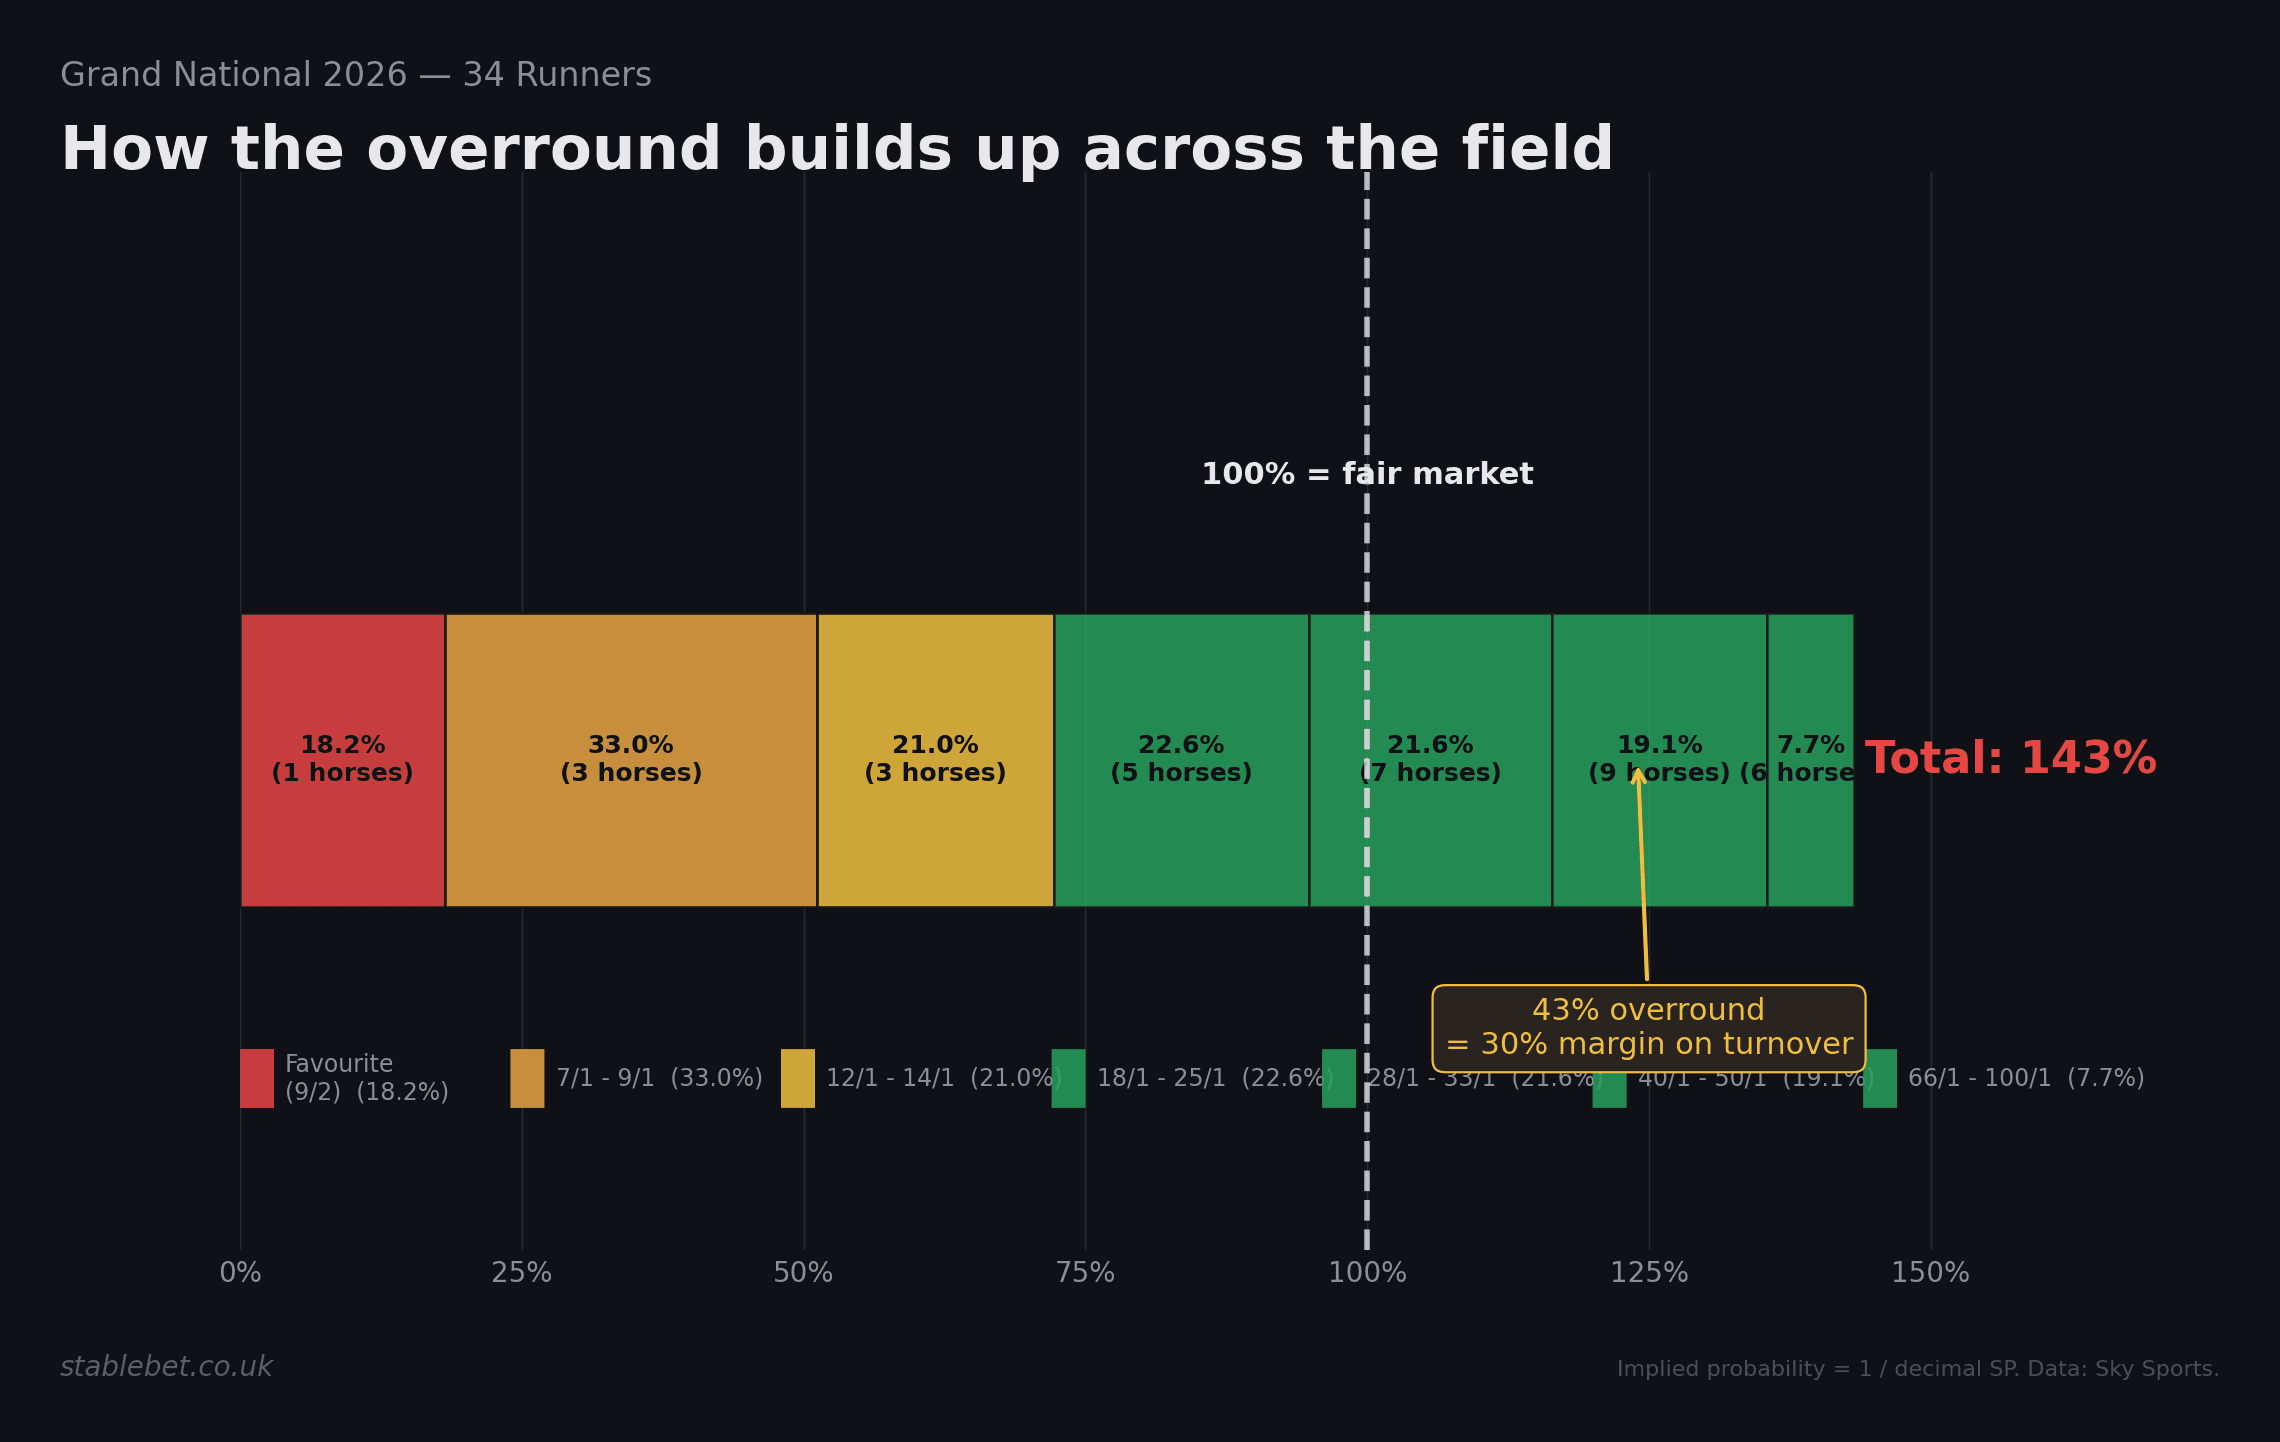
What Is Overround? How Bookmakers Price a 34-Runner Race
Take every horse's starting price, convert it to an implied probability (the chance of winning that the price represents), and add them all up. In a fair market, they would sum to exactly 100%. One horse wins. The probabilities should add to one.
They do not. On the 2026 Grand National, the starting prices summed to approximately 143%.
That extra 43% is the overround, sometimes called the vigorish or the book margin. It is the mechanism by which bookmakers guarantee their profit regardless of which horse wins. Every price on the card is shortened from its true value so that the sum of implied probabilities exceeds one.
The margin this represents on bookmaker turnover is calculated as:
Margin = (overround - 100) / overround
At 143% overround: 43/143 = 30%.
On an estimated £250 million wagered nationally on the Grand National, a 30% margin represents approximately £75 million in built-in bookmaker edge before a single race is run. That is a theoretical maximum. It assumes every bet is placed at SP, ignores best odds guaranteed refunds, free bet promotions, and the lower margins available on the Betfair Exchange. The real industry take is lower. But the scale of the structural advantage is clear.
Shopping around on odds comparison sites or using BOG offers reduces the overround you face as a punter. If you take the best available price across a dozen bookmakers, the effective overround might drop to 115-120%. Still above 100%. Still a negative expectation for every bet on the card.
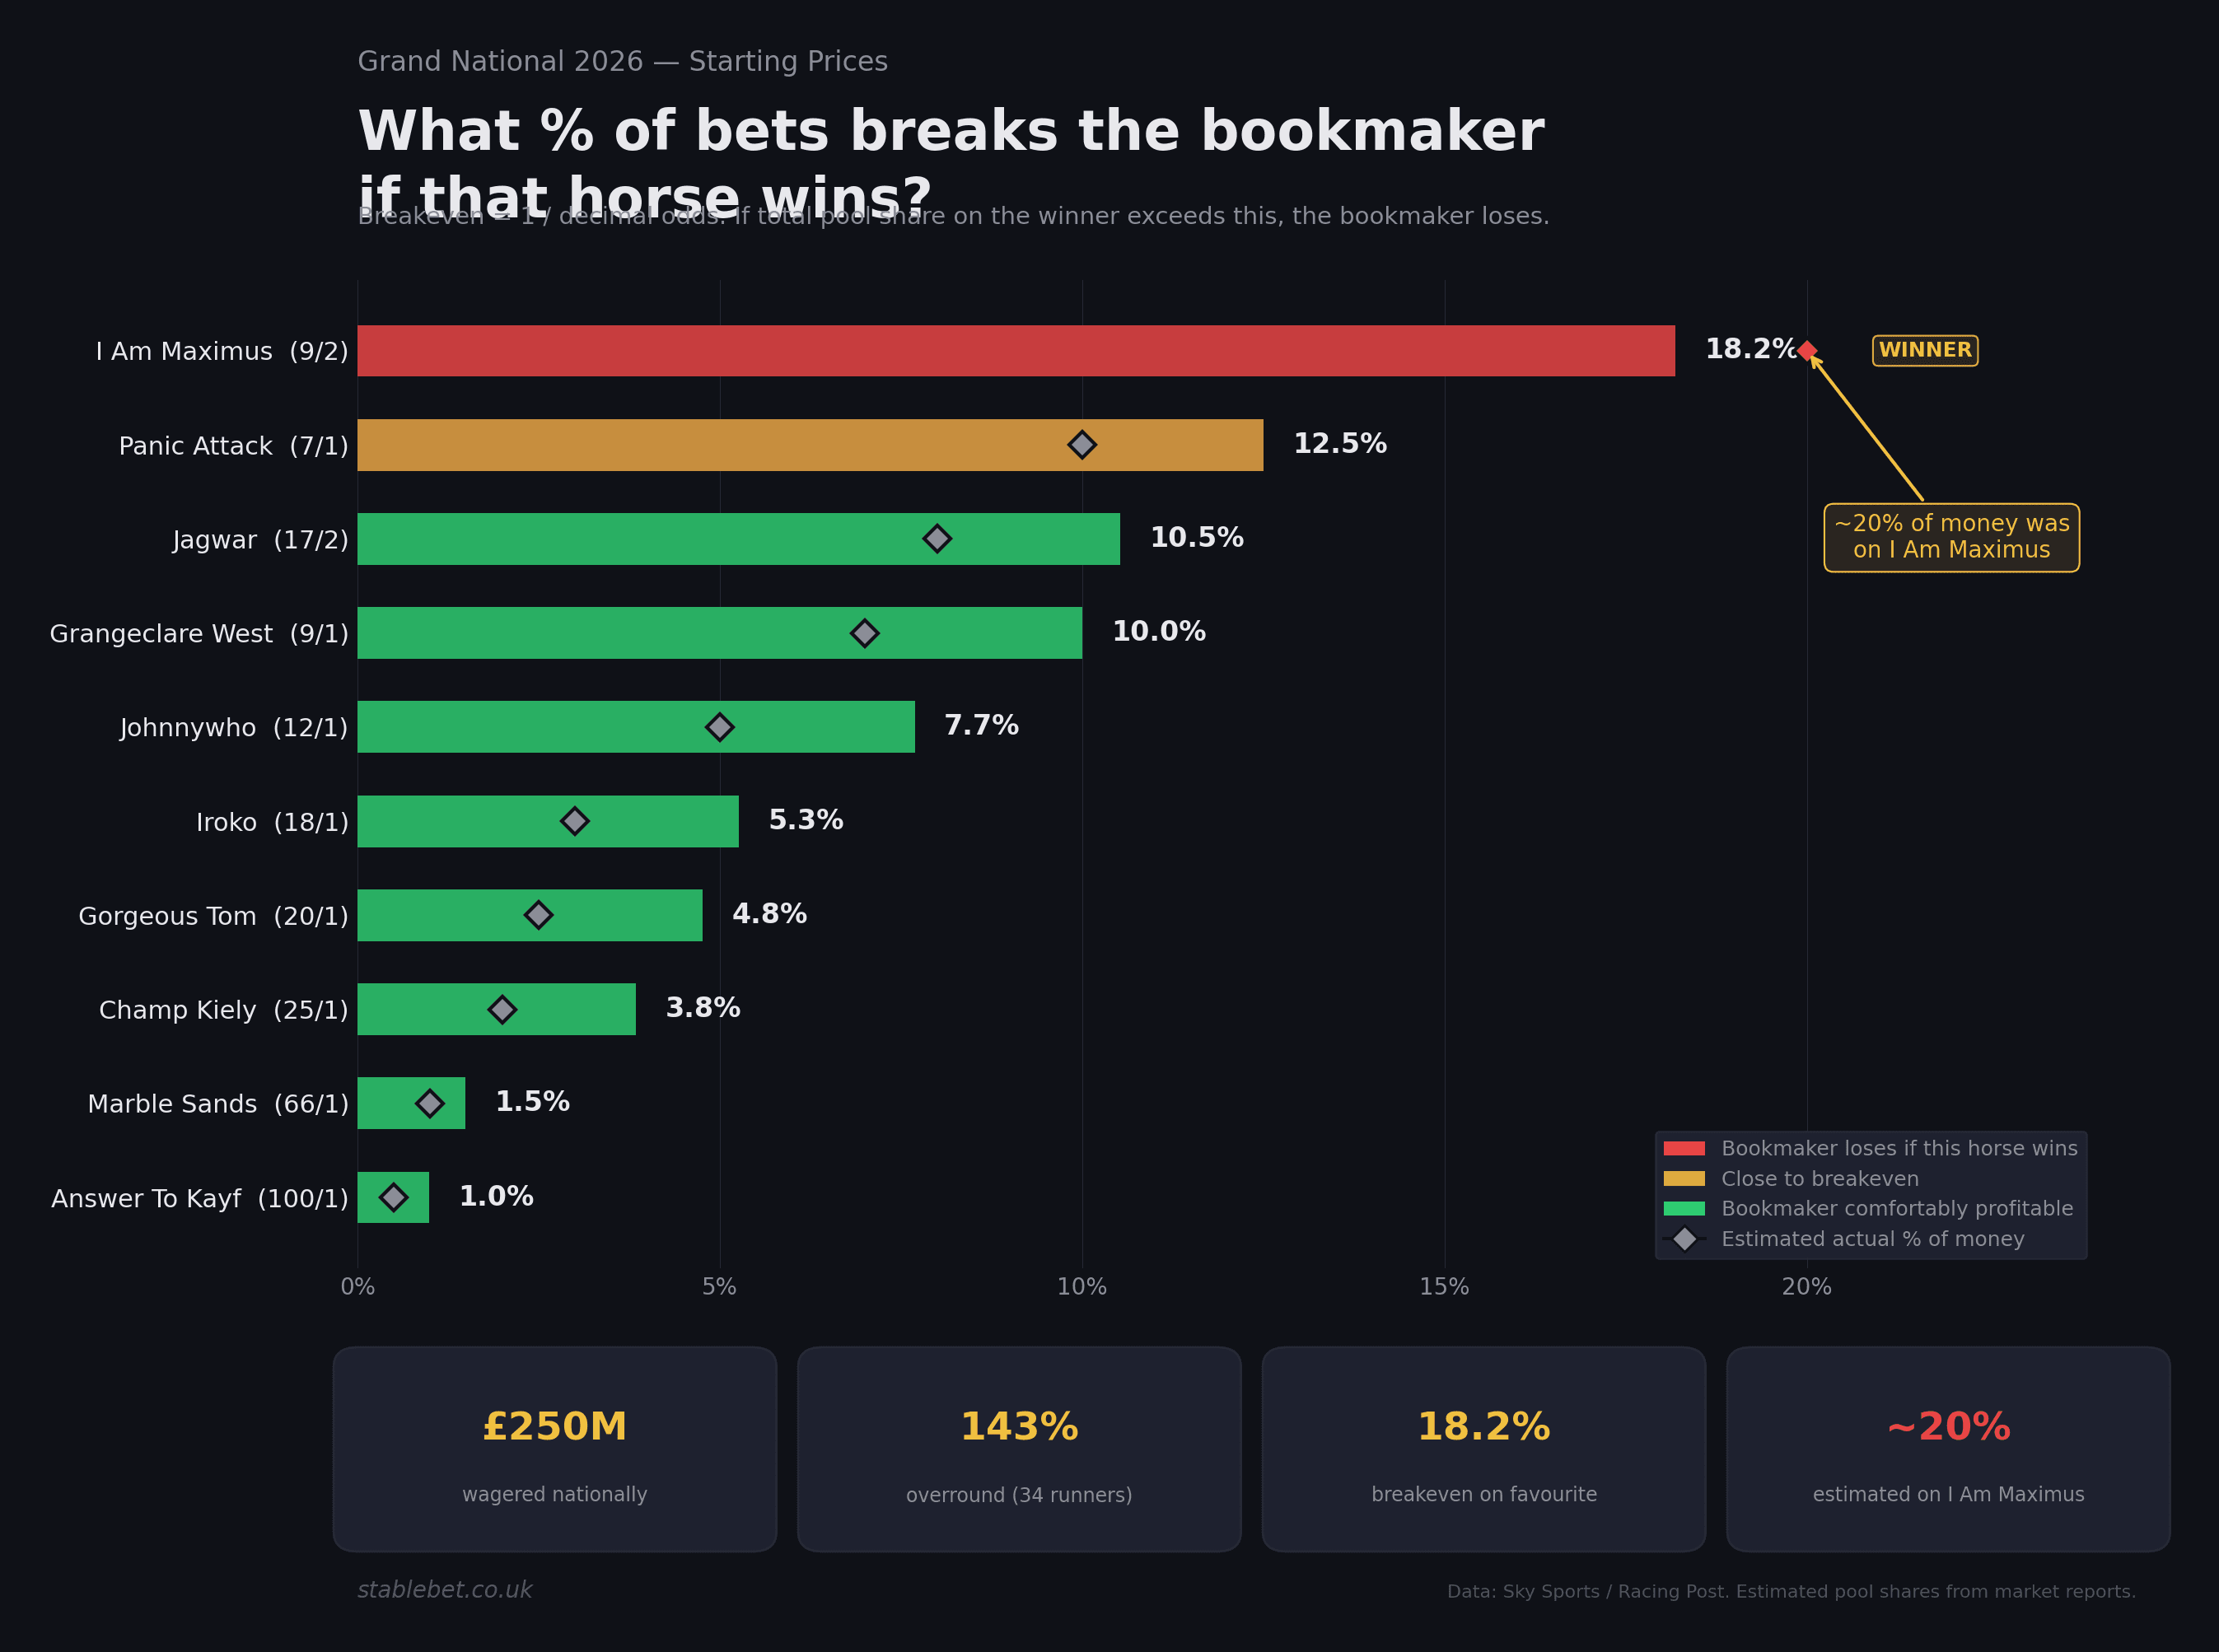
The Breakeven Threshold: When Does a Bookmaker Lose Money?
The overround tells you the bookmaker's aggregate edge across the whole race. But a sharper question exists for individual horses: at what point does the bookmaker actually lose money if a specific horse wins?
The formula is simple.
At decimal odds D, the bookmaker pays out D times the stake on every winning bet. If too much of the total pool concentrates on one horse, the payout exceeds the sum of all losing stakes.
The breakeven threshold is: 1 / D
If more than 1/D of total money wagered goes on the winning horse, the bookmaker loses on that race.
Here is the breakeven threshold for the main runners at their starting prices:
| Horse | SP | Decimal | Breakeven threshold |
|---|---|---|---|
| I Am Maximus | 9/2 | 5.5 | 18.2% |
| Panic Attack | 7/1 | 8.0 | 12.5% |
| Jagwar | 17/2 | 9.5 | 10.5% |
| Grangeclare West | 9/1 | 10.0 | 10.0% |
| Johnnywho | 12/1 | 13.0 | 7.7% |
| Iroko | 18/1 | 19.0 | 5.3% |
| Marble Sands | 66/1 | 67.0 | 1.5% |
| Answer To Kayf | 100/1 | 101.0 | 1.0% |
The longer the price, the lower the breakeven threshold, and the less money needs to concentrate on that horse for the bookmaker to lose. That sounds like outsiders should be riskier for the bookmaker, but the opposite is true in practice: casual punters rarely put significant money on 100/1 shots. The favourite is where the volume goes.
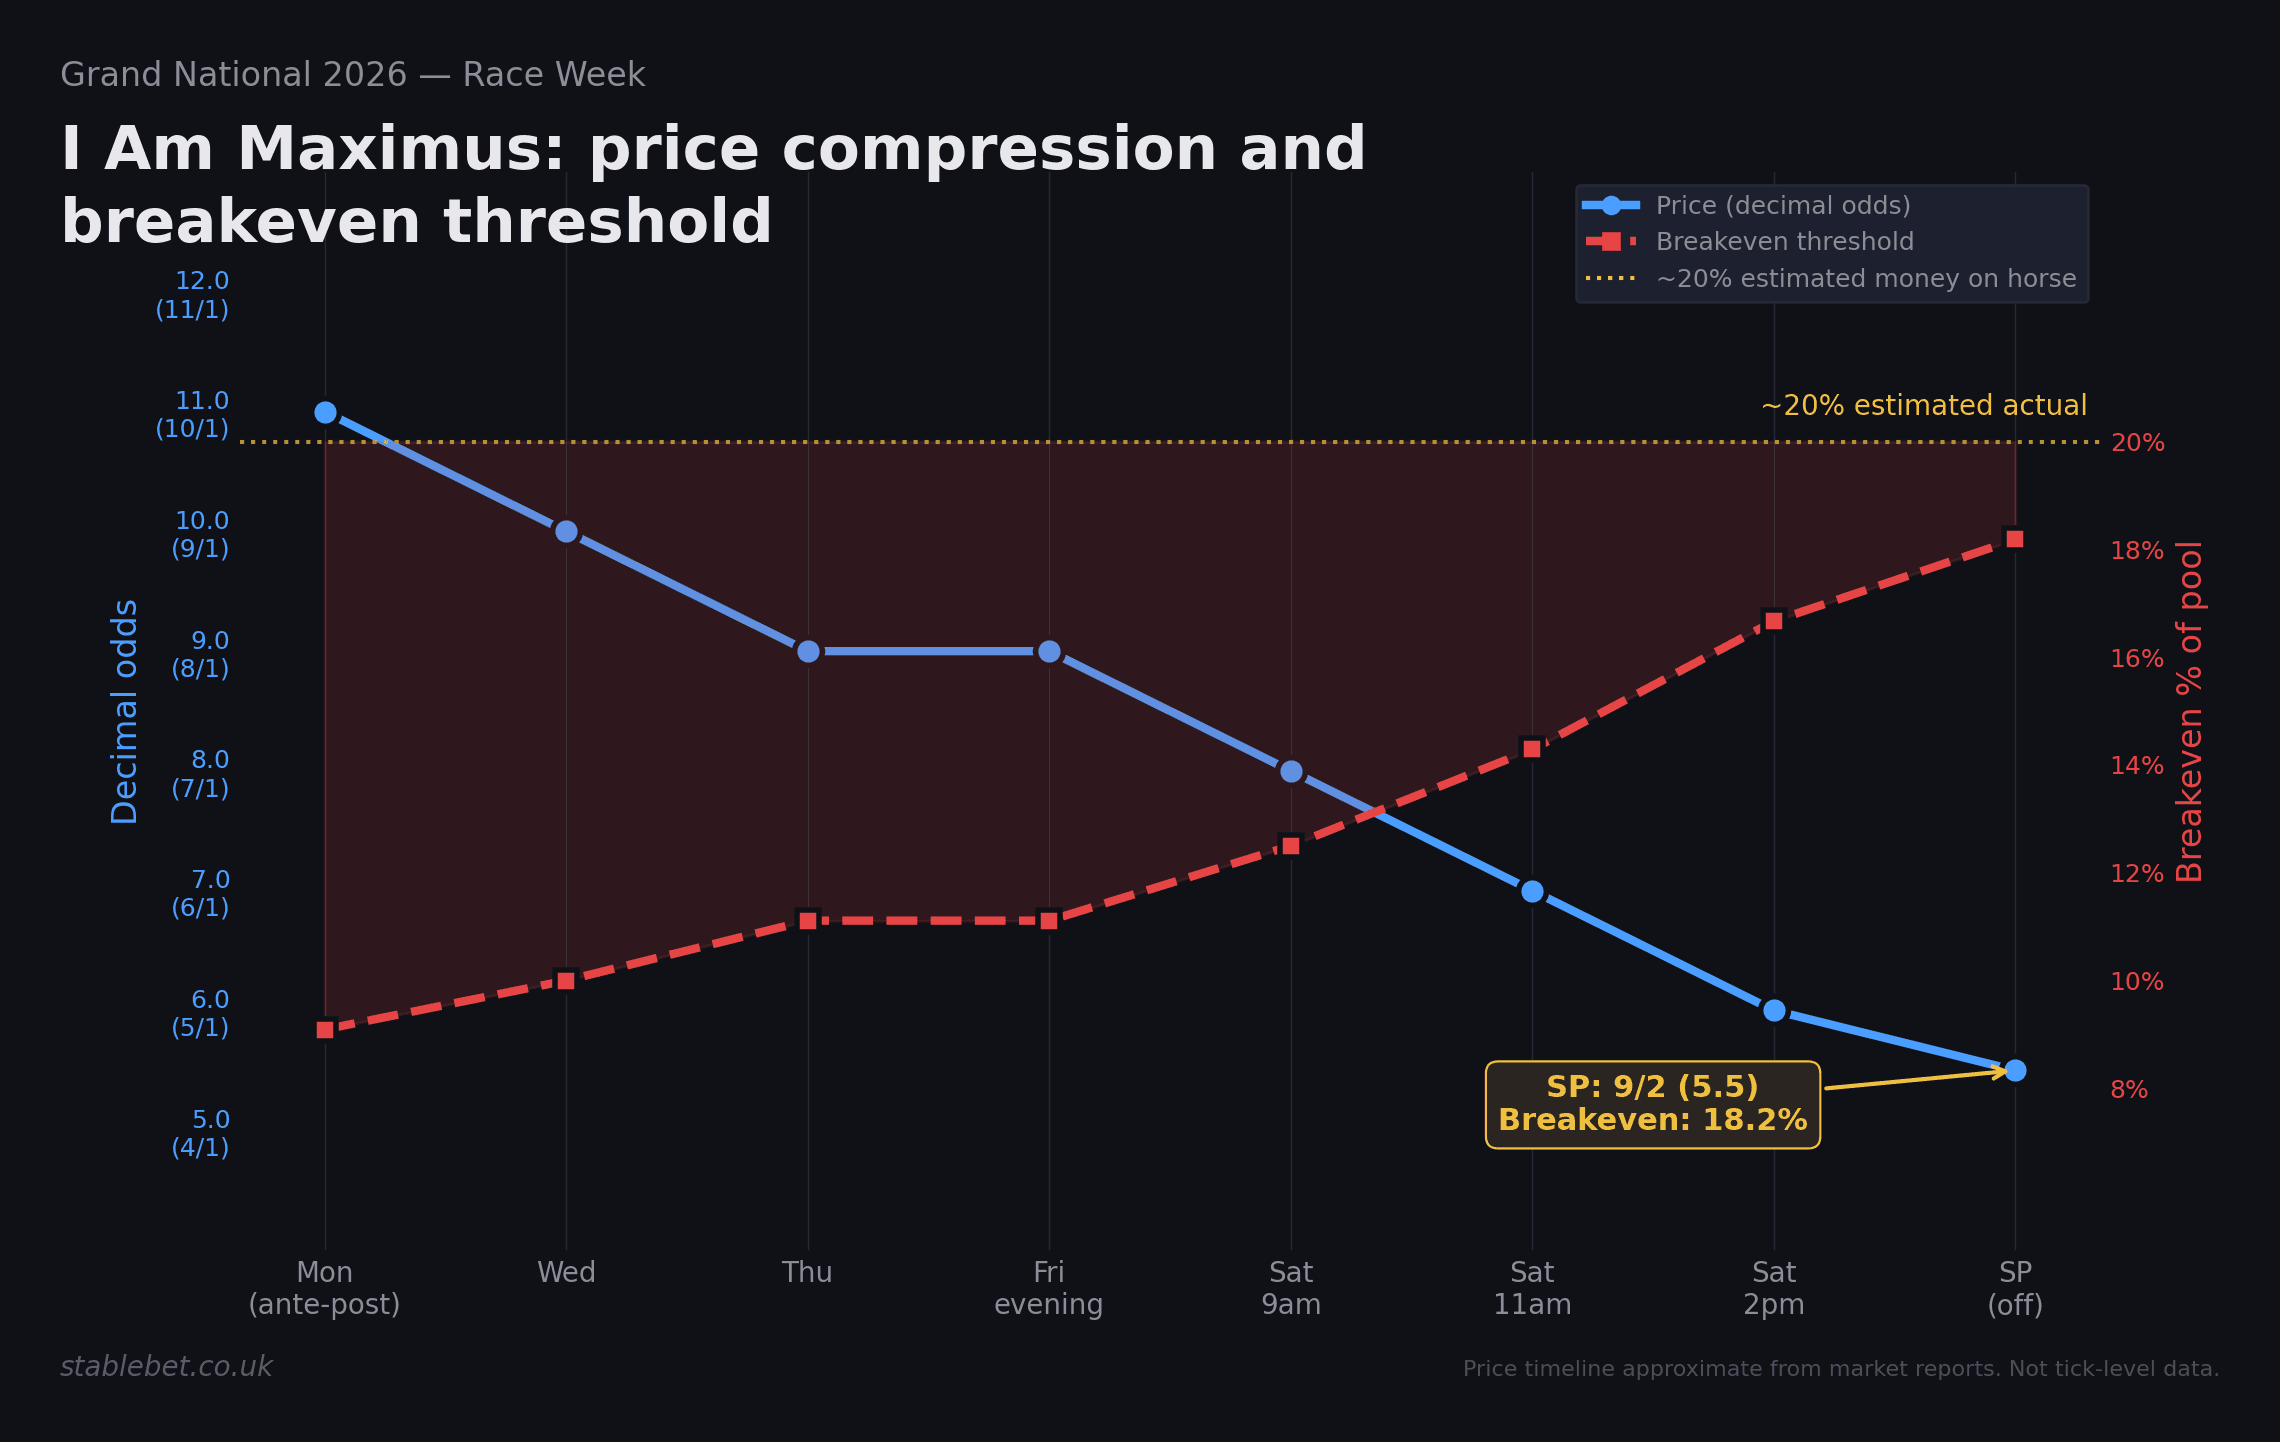
I Am Maximus: The One Horse That Cost Bookmakers Money
I Am Maximus won the 2024 Grand National, then finished second in 2025 behind Nick Rockett. Returning in 2026 to regain the title, he was available at 10/1 and longer in the ante-post markets.
Then the money arrived.
He was backed steadily from 8/1 through 7/1, 6/1, 11/2 and into a starting price of 9/2 as punters piled on the only horse since Red Rum to regain the Grand National title. At 9/2 (5.5 decimal), the breakeven threshold is 18.2% of total pool money. Market estimates suggest around 20% of Grand National bets went on I Am Maximus on the day, driven by his record and the weight of public sentiment.
He was the only horse on the 34-runner card where that threshold was likely breached. He won.
The Racing Post reported that bookmakers were hit for tens of millions of pounds following the result. Betfred founder Fred Done described the payout as a "gladiatorial bloodbath." William Hill confirmed payouts north of £10 million on the race alone. One punter walked away with approximately £800,000 from a £100,000 bet placed at 8/1 on course.
For any of the other 33 outcomes, the overround holds. The bookmaker pays out, pockets the margin, and moves on. The I Am Maximus result was the one scenario, on the one horse, where the concentration of money exceeded the breakeven point. It happens. It is priced into the long-term business model.
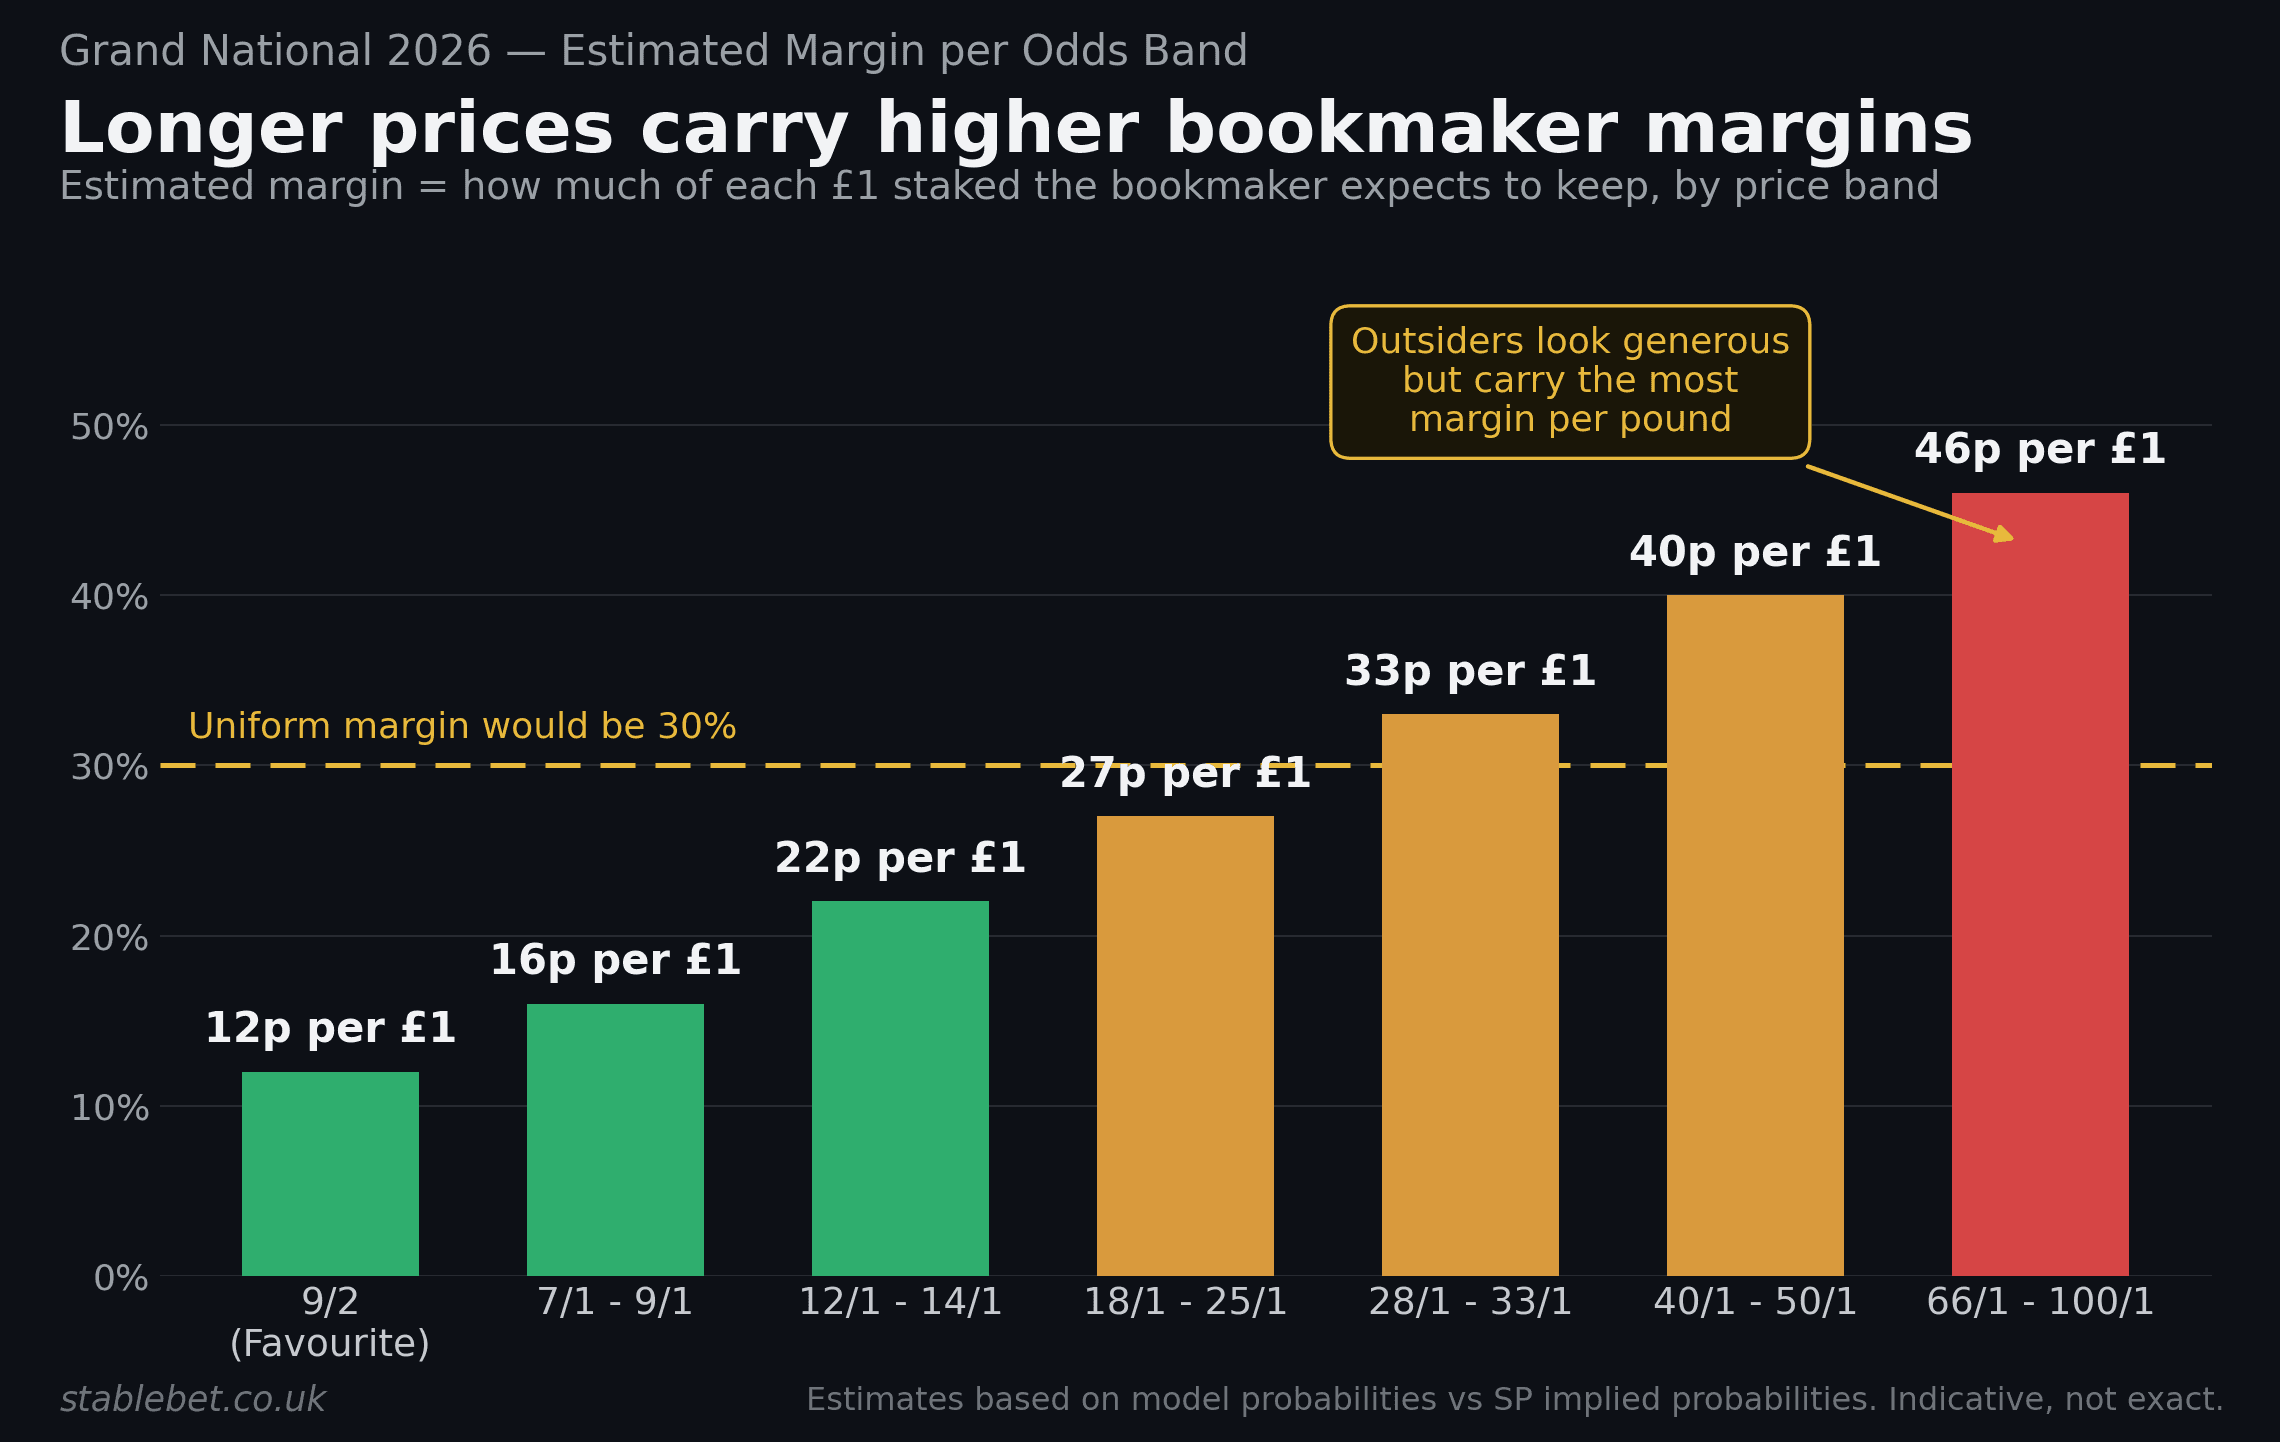
Why Outsiders Look Like Good Value (And Why They Are Not)
The loss-per-pound figures tell a story that bookmaker marketing never does: the margin is not distributed evenly across the field.
On the favourite, the estimated loss per £1 is around 12p. On a 100/1 shot, it is around 48p. Favourite prices are kept tight. Outsider prices carry far more margin.
This is deliberate. The front of the market is where the scrutiny is. Professional punters, exchange traders and odds comparison sites all police the prices of the fancied horses, so a bookmaker who shades the favourite too hard loses that business to a rival. Nobody polices a 100/1 shot. Casual Grand National punters pick a name off the racecard, or back a trainer who dominated Cheltenham at a big price, chasing the tenner that turns into £670. Bookmakers know exactly where that once-a-year money goes and price accordingly: keen margins where the sharp money looks, heavy margins on the dream tickets. The stakes on any single outsider are small, which is why the liability never worries anyone. But per pound staked, that money is the most profitable on the card, and it almost never comes back.
The outsider odds only look generous. If Answer To Kayf's true chance is closer to 200/1 than 100/1, then 100/1 is the most expensive price on the card, however big the number sounds. And the effect compounds with field size. A typical race carries an overround of around 12 percentage points. In fields of 16 or more runners, it climbs towards 30. A 34-runner Grand National, where almost every horse is a longshot, is the extreme case: the more big prices on the card, the more places there are to hide margin.
The outsiders are where the margin is made. The dream is the bait.
This is the architecture of a well-constructed betting market. It is not a flaw in the system. It is the system working as designed.
Where Value Betting Genuinely Exists in Horse Racing
If the Grand National is not the place to find value, where is it?
Genuine value in horse racing tends to appear where the bookmaker's information advantage is smaller:
- Betting exchanges: On the Betfair Exchange, you bet against other punters rather than a bookmaker. The overround is close to zero (typically around 102%), though Betfair takes a commission on net winnings (base rate 5%). The Exchange Starting Price is widely considered the most efficient price available.
- Smaller fields with less attention: A midweek novice hurdle at Sedgefield attracts less professional trading than the Grand National. The odds are set less precisely. Edges, where they exist, are more likely to survive.
- In-play markets: Prices move faster than traders can respond during a race. Moments of mispricing occur, though exploiting them requires real-time data and fast execution.
- Early ante-post markets: Ante-post betting months before a race happens in a thinner market. Bookmakers sometimes overprice or underprice before information firms up. The trade-off: you lose your stake if the horse does not run.
On marquee races like the Grand National, with hundreds of millions in turnover and professional quantitative traders active on both sides, the market is about as efficient as horse racing gets. Finding a systematic edge requires either information the market does not have, or a model calibrated well enough to identify mispricings consistently across hundreds of races. We are building toward the latter. On 34 Grand National runners, in a 143% book, it was not close.
Moral of the story? Stick to poker.
Key Takeaways
- The 2026 Grand National starting prices summed to 143% implied probability, representing a 30% margin on bookmaker turnover.
- On an estimated £250 million in bets, that margin represents roughly £75 million in structural bookmaker edge.
- Our XGBoost model with retrieval layer found zero value bets across all 34 runners.
- The breakeven threshold for the favourite was 18.2% of pool money. Estimated actual share was ~20%. I Am Maximus was the only horse where bookmakers likely lost money.
- Bookmakers were hit for tens of millions on the result. That outcome is the exception, not the rule.
- Margin is loaded onto outsiders and longer-priced horses, not the favourites. The longer the price, the more of each pound the bookmaker expects to keep. This is structural, not accidental.
- The Grand National is one of the most efficient betting markets in UK racing. It is not the place to start looking for value.
Methodology and Data Sources
Race data: Three seasons (2022/23, 2023/24, 2024/25) of UK National Hunt results. Features include last-three finishing positions, beaten lengths, weight carried, days since last run, jockey/trainer strike rates (14-day, course-specific), official BHA ratings, race class, and field size.
Weather: Hourly historical observations from Open-Meteo, matched to racecourse location and race date.
Odds: Starting prices from Sky Sports and Racing Post, cross-referenced against Betfair Exchange closing prices where available. Overround calculated from the full 34-runner SP field.
Retrieval layer: Race commentary and previews from public sources, embedded using a sentence-transformer model, retrieved at prediction time and passed to a language model for probability adjustment capped at plus or minus 10 percentage points.
Estimated pool shares: Derived from exchange market data and industry reports. No bookmaker publishes exact bet distribution per horse, so these figures are approximate and should be treated as indicative.
The model remains in active development. We are expanding through more seasons and running walk-forward backtests across the full National Hunt calendar.
Frequently Asked Questions
Share this article
Research the field with the AI Race Predictor
Our model publishes calibrated win-probability estimates for UK races — a second opinion to understand a race, not tips. It's open about its record: it doesn't beat the market, and we show exactly how it does.
Betting offers for Grand National
Work it out & learn the basics
Gamble Responsibly
Gambling should be entertaining and not seen as a way to make money. Never bet more than you can afford to lose. If you or someone you know has a gambling problem, help and support is available.